What does my PageSpeed Insights score ACTUALLY mean?
As we use more mobile devices the speed of a page matters more and more. I delve into what the PageSpeed Insights tools results actually mean.
The question that comes to my head most during development is:
"How can I make this easier?"
I think that's pretty standard for a developer, however the next question I ask myself:
"How can I make this page faster?"
Making a page faster is always a challenge. Lots of things can affect the speed of a page, and if Google are releasing tools telling you your page speed, it matters. So, the first thing you need to do is get a benchmark.
PageSpeed Insights gives you the ability to test how fast your page is on a mobile and a desktop. If you're working on a larger site, it may even give you real world load times from your users.
PageSpeed Insights has changed recently, it used to analyse the page and see whether you had hit certain optimisation goals. Now, if you're a small site it will show you the lighthouse results. If you're a larger site, it will also show you how long it's taking real world users.
So, lets get an example of the BBC's homepage:

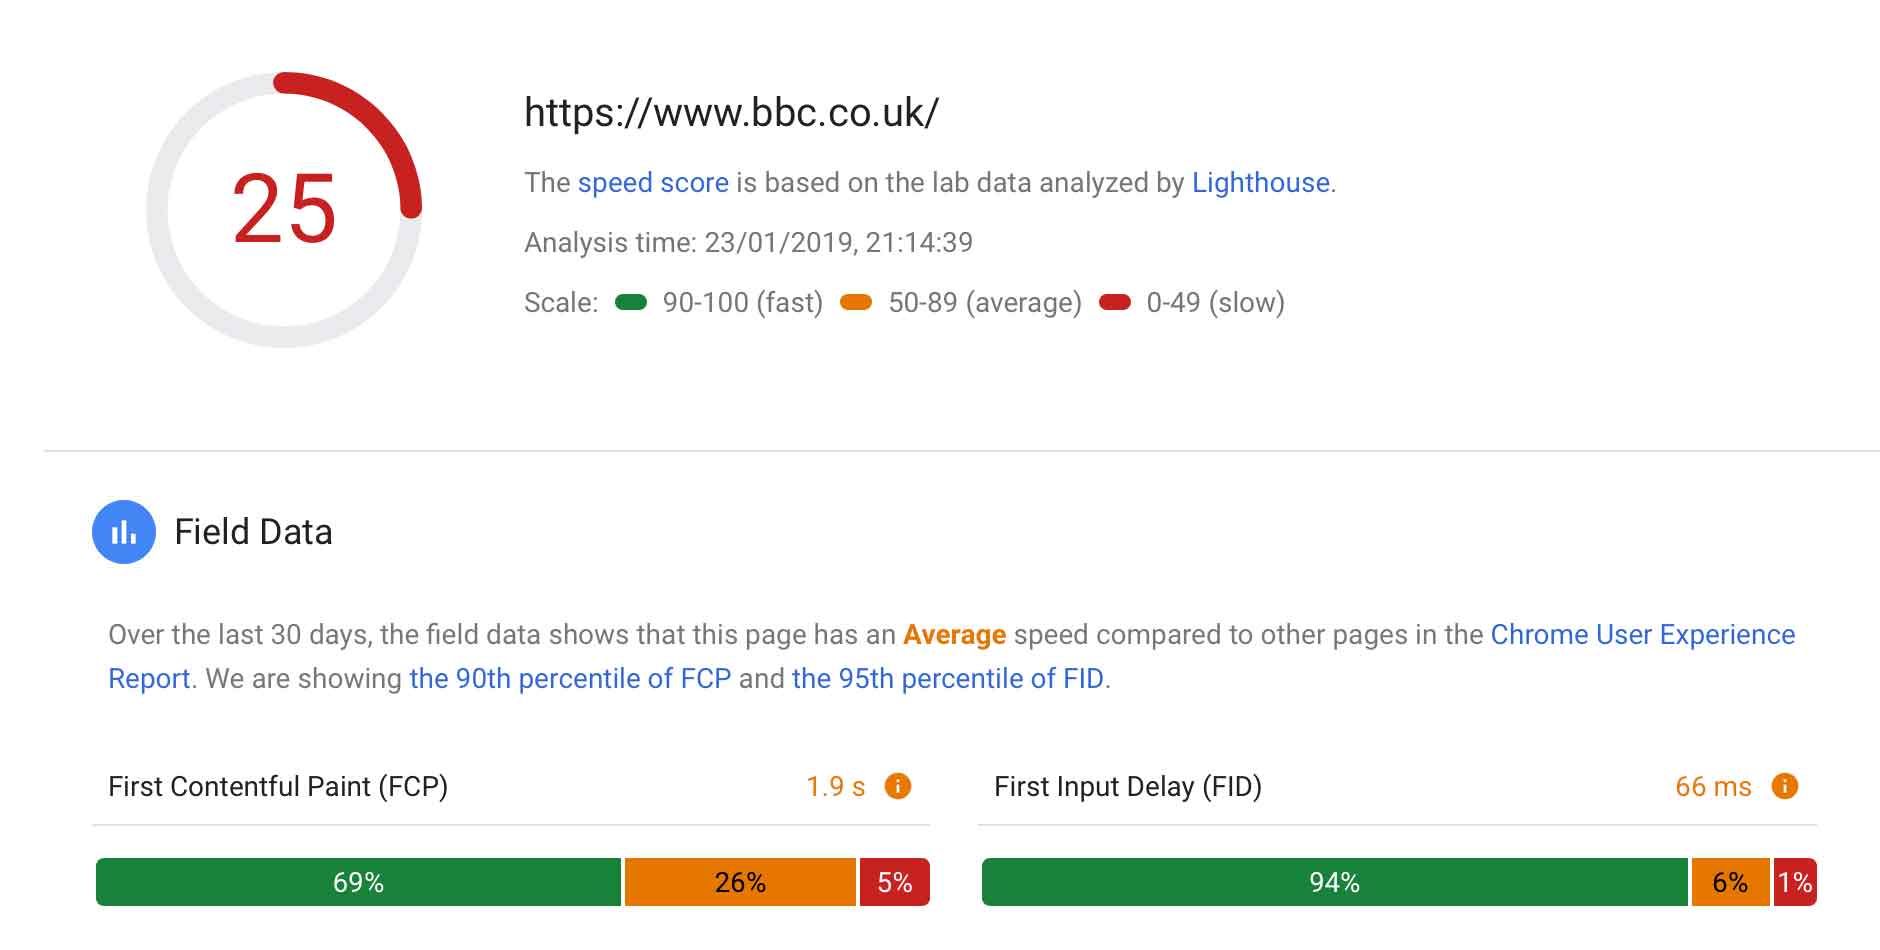
As you can see, it scores 25/100 on mobile.
At the bottom of the screenshot you can see the 'Field Data' section. This is how long it took your users on average. It took 1.9 seconds for the BBC's site to load any content at all. That means that the screen would have been blank for 2.9 seconds before anything appeared on the screen.
The second number is the First Input Delay. This is how long it took from the first user interaction to the browser actually responds to the action. (e.g. clicking a button, opening a menu etc.) On the BBC it was 64ms which is okay - not great but passable. This is normally due to large JavaScript files been executed by the browser.

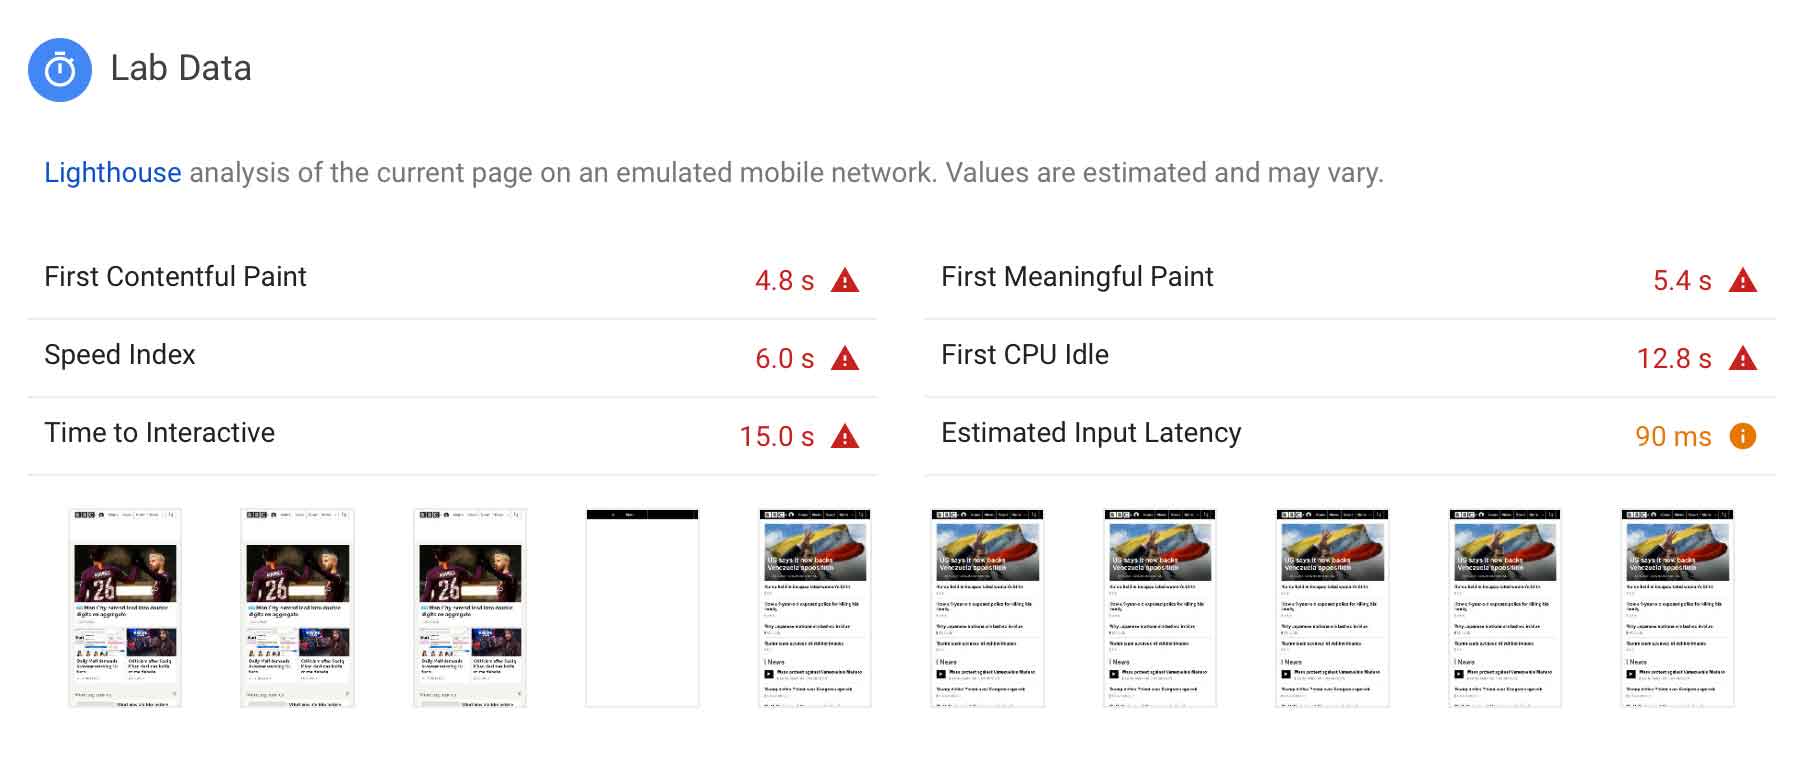
As you can see the above paints a better picture of exactly how long it took to load the BBC homepage.
First Contentful Paint
: This is how long it took any content to load onto the page, whether this be text, images etc.
First Meaningful Paint
: This is how long it took to actually get a decent amount of content, enough for the user to read headlines etc.
Speed Index
: This is how long it took to fir the content to be visually populated.
First CPU Idle
: This is the last time the device had to stop thinking about loading the page.
Time to Interactive
: This is how long it took before the user was able to click. buttons, scroll down etc. without lag.
Estimated input latency
: This is how long it took the page to react to a users input.
The above stats give a more detailed overview of what a user can expect when they load a page. 53% of users can drop off if a page takes longer than 3 seconds to load.
So how can I make my pages better?
Let's go through each point and dicuss the principles behind it, and a few things to look at to speed it up.
First Contentful Paint
The first of these is the First Contentful Paint. Getting content infront of your users should be a top priority, once they see content, they can start to decifer if what you're showing them is what they expect and want.
To speed this up, the the first thing you can do is keep the amount of requests in your <head> section to a minimum, load your JavaScript and CSS at the end of the <body>.
First Meaningful Paint
Secondly is the First Meaningful Paint, you want your users to be able to use your site as soon as possible. A site feels faster once their is content on the page, as this gives the user a response and they can start reading. The earlier they can read, the better, even if the rest of the content, styling etc. is still loading. If they can see the 'above the fold' content, the experience seems more seemless.
You can easily make your site feel quicker by deferring JavaScript and CSS and only loadind Critical CSS along with content.
Speed Index
Next is showing your site to the user, as it should be, this might mean that the JavaScript hasn't finished rendering. However the page still looks and feels as it should.
To speed this up, there are 2 things that you may want to look at optimising content efficency and your critical render path.
To address the former, optimising for content effiency, this means making your site easier to understand for the browser by reducing the amount of content or speeding up JavaScript files. Making the code behind your site more efficent by reducing uneeded sections, stop using watchers and timers will increase the speed. This is probably the most difficult thing to do, as web apps and websites in general are becoming more and more complicated.
Most development is done on a Desktop device, but most content is consumed on a Mobile device. So a mobile phone needs to execute the same scripts as you do on the desktop. Although modern phones are getting quicker all the time, they struggle with loads like executing JavaScript compared to desktop class CPU's. (I know some newer devices can out perform desktop class processors. However right now, most users aren't using these top-end devices)
First CPU Idle
This is a measure that takes place when the the page is minimally interactive. So Most UI elements will work but maybe not all of them and the page responds to any interactions within a reasonable amount of time.
The above points for Speed Index also apply here, optimising the content efficency and critcal rendering path will also improve the Speed Index.
Time to Interactive
This happens once the page:
has displayed some useful content (First Contentful Paint)
has registered most of the event handlers for the pages visual elements
responds within 50ms to user input
To speed this up you need to optimise JavaScript start-up times and reduce JavaScript payloads.
There's a great post over on Google Developer on Optimsing JavaScript start-up times however to summarise:
only send the JavaScript the user needs
minify the JavaScript (and all resources for that matter)
compress the files
remove any unused code
employ a decent caching policy
To reduce JavaScript payloads I'll point you to another 2 artcles on Google Developer on Reducing JavaScript payloads with tree shaking. This is the practice of only using the JavaScript you need. Cutting out any old, unused dependancies. Doing the same for any of your own code will also speed up your application or website.
Another way of reducing JavaScript payloads is through code splitting. It has been a trend in the industry for a long time until recently to bundle up all JavaScript files. This is usually the case because of HTTP/1.1's limitations to only allow one files to download at once. However, splitting your code up and only sending the revant JavaScript will help speed your site up, epsecially if this can also then be sent via HTTP/2. HTTP/2 allows mutiple downloads at once which will also speed up your application or website.
Estimated input latency
We all know how annoying it is when something is laggy. You press a button and you have to wait for something to happen. This stat shows you how long it takes from a user clicking a UI element to something actually happening. Another over 100ms will feel laggy to a user. Ideally this should be under 50ms.
To reduce this latency you will need to optimise your code, this maybe by using Web Workers to handle some of the computation, to using less CSS selectors to reduce computation time.
This audit however does have it's limitations. PageSpeed Insights measures the time taken from interacting with the page to the CPU completing the request and pixels being diosplayed on the screen. This runs between the First Meaningful paint for around 5 seconds after that. Meaning that, once your main thread is free from loading all the elements omn the page, this number could be lower.
Opportunities, Diagnostics and Passed audits
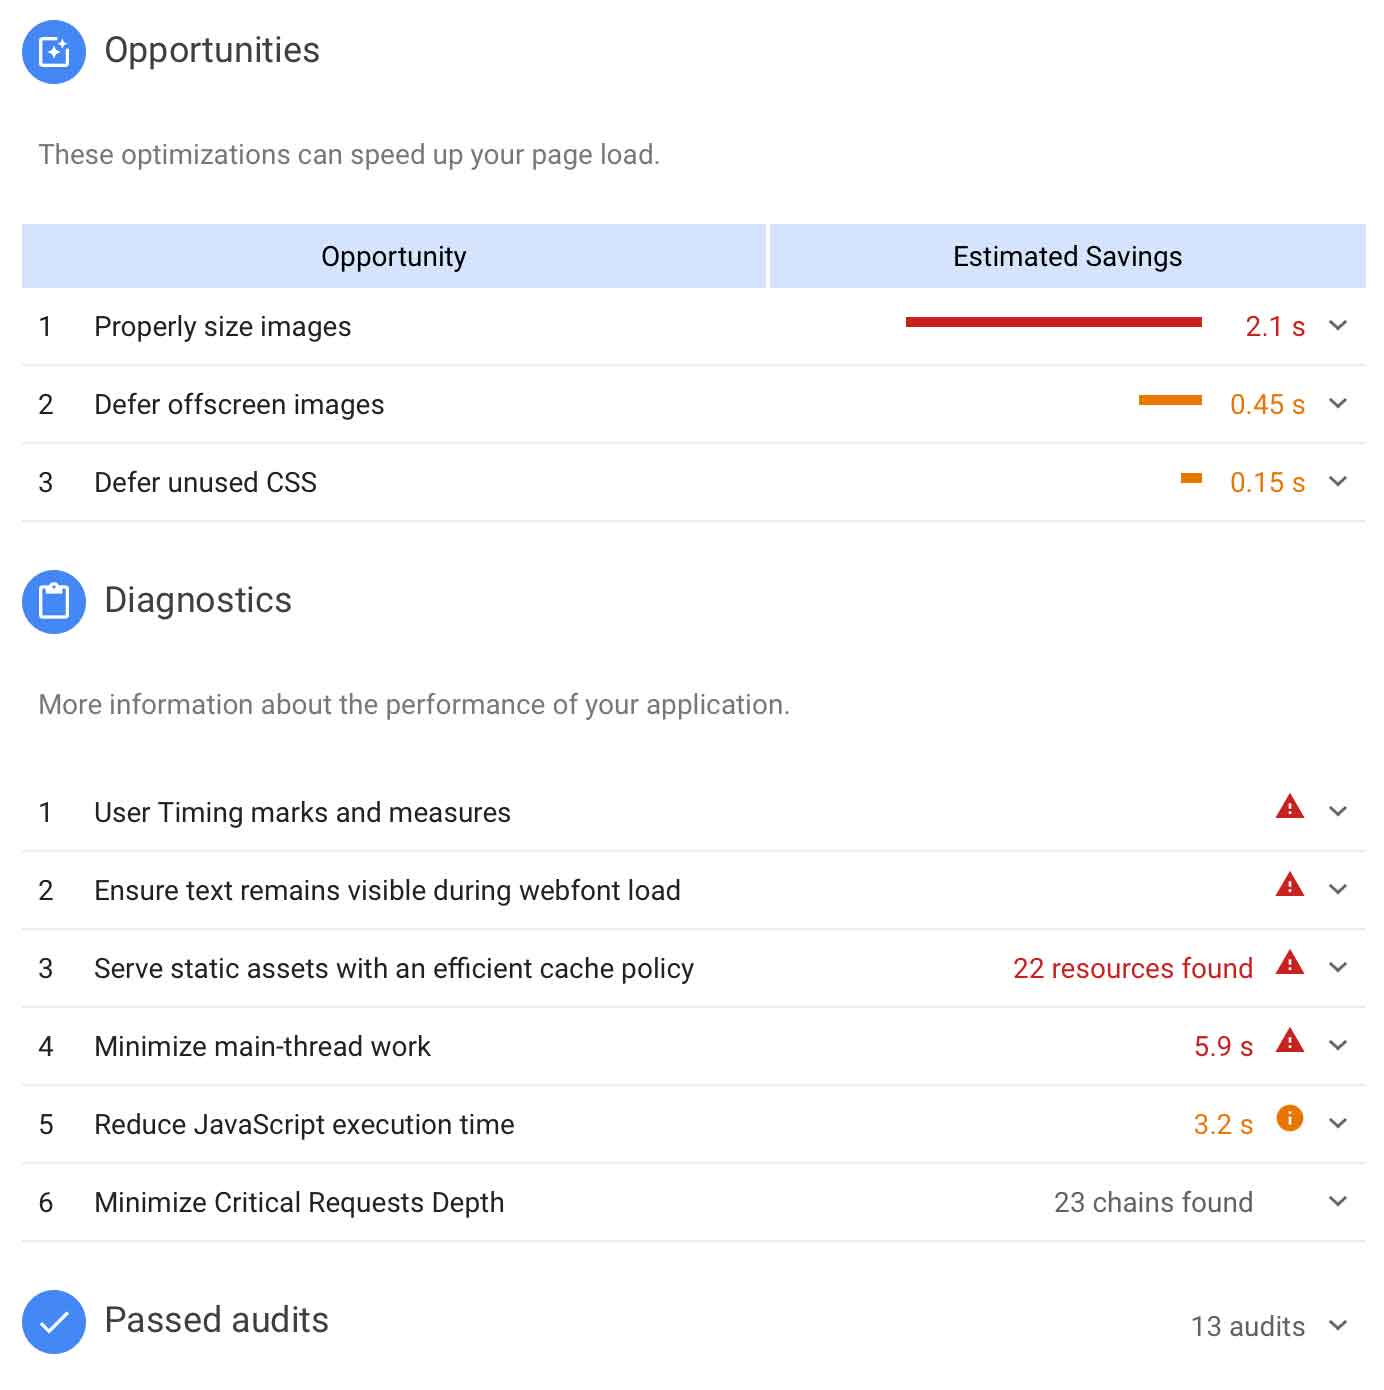
Finally PageSpeed Insights will also show you some opportunities to improve your page speed, these are usually optimisations and can include reducing the size of images, compessing code or images and defering any code that;s not needed.

Opportunities
These are usually self explanitory and, when clicked give more detail on how to solve the problem. It should also show you the offending item(s).
For instance in the screenshot above, by reducing the dimensions of the images to the be the maxiumum dimensions they will be in the viewport will save download time (As the images will be a smaller filesize) and CPU decode time (As the images wont take as long to decode).
Diagnostics
Similar to the above, these are usually self explanitory and, when clicked give more detail. It should also show the offending item(s).
These are normally global issues that need to be fixed to speed up the page.
Passed audits
After telling you all the problems and issues, the final heading is some resolute